Inlined linked image
Source Link
user2995
user2995

That's Nyquist-Shannon sampling theorem. Think about it in the other way: imagine you are given a set of samples (the black dots in the image).

http_://i.sstatic.net/ld5VI.png

I would appreciate if someone could edit this into an actual image, not enough rep.https://i.sstatic.net/ld5VI.png
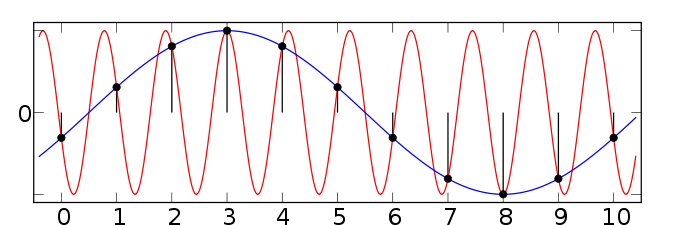
The most intuitive way to recover the original analog signal would be by joining these samples. But you can easily notice that there is not a unique way of joining them. In fact, there are infinite possible signals that would contain the whole set of samples. Obviously, given the sample set, you would join them the easiest way, i.e. the blue signal.

Now, what about sampling? In the image you also have a red signal (which frequency is 1 Hz) that has been sampled too slowly, resulting in the black dot sample set. To have a clue about the real signal, we should have sampled it at, at least, 2 Hz. That way, we also would have samples (dots) at 0.5, 1.5, 2.5, etc seconds. And, as you can draw in Paint, the easiest path to join all the samples would be, again, the red signal. So we would have recovered our original signal successfully.

That's Nyquist-Shannon sampling theorem. Think about it in the other way: imagine you are given a set of samples (the black dots in the image).

http_://i.sstatic.net/ld5VI.png

I would appreciate if someone could edit this into an actual image, not enough rep.

The most intuitive way to recover the original analog signal would be by joining these samples. But you can easily notice that there is not a unique way of joining them. In fact, there are infinite possible signals that would contain the whole set of samples. Obviously, given the sample set, you would join them the easiest way, i.e. the blue signal.

Now, what about sampling? In the image you also have a red signal (which frequency is 1 Hz) that has been sampled too slowly, resulting in the black dot sample set. To have a clue about the real signal, we should have sampled it at, at least, 2 Hz. That way, we also would have samples (dots) at 0.5, 1.5, 2.5, etc seconds. And, as you can draw in Paint, the easiest path to join all the samples would be, again, the red signal. So we would have recovered our original signal successfully.

That's Nyquist-Shannon sampling theorem. Think about it in the other way: imagine you are given a set of samples (the black dots in the image).

https://i.sstatic.net/ld5VI.png

The most intuitive way to recover the original analog signal would be by joining these samples. But you can easily notice that there is not a unique way of joining them. In fact, there are infinite possible signals that would contain the whole set of samples. Obviously, given the sample set, you would join them the easiest way, i.e. the blue signal.

Now, what about sampling? In the image you also have a red signal (which frequency is 1 Hz) that has been sampled too slowly, resulting in the black dot sample set. To have a clue about the real signal, we should have sampled it at, at least, 2 Hz. That way, we also would have samples (dots) at 0.5, 1.5, 2.5, etc seconds. And, as you can draw in Paint, the easiest path to join all the samples would be, again, the red signal. So we would have recovered our original signal successfully.

Source Link
Serge
  • 186
  • 1
  • 10

That's Nyquist-Shannon sampling theorem. Think about it in the other way: imagine you are given a set of samples (the black dots in the image).

http_://i.sstatic.net/ld5VI.png

I would appreciate if someone could edit this into an actual image, not enough rep.

The most intuitive way to recover the original analog signal would be by joining these samples. But you can easily notice that there is not a unique way of joining them. In fact, there are infinite possible signals that would contain the whole set of samples. Obviously, given the sample set, you would join them the easiest way, i.e. the blue signal.

Now, what about sampling? In the image you also have a red signal (which frequency is 1 Hz) that has been sampled too slowly, resulting in the black dot sample set. To have a clue about the real signal, we should have sampled it at, at least, 2 Hz. That way, we also would have samples (dots) at 0.5, 1.5, 2.5, etc seconds. And, as you can draw in Paint, the easiest path to join all the samples would be, again, the red signal. So we would have recovered our original signal successfully.